A Sherman Oaks real estate data report is a summary of recent local market activity. It usually covers median sale price, active inventory, days on market, sale-to-list ratio, and price per square foot, and it helps buyers and sellers see where the market is right now. The report is only useful if you read it in the right context, because Sherman Oaks holds several quite different housing markets inside one zip-code-sized area.
Here's how to read one, what each number actually tells you, and where the averages can mislead you.
What is in a Sherman Oaks real estate data report?
Most local market reports, including the monthly community guides we publish on our Sherman Oaks homes and market info page, are built from publicly available listing and sales data. Ours come from Redfin and Zillow. The core metrics are usually the same:
- Median sale price. The midpoint of what homes actually sold for during the period.
- Active inventory. How many homes are for sale right now.
- Days on market. How long homes typically sit before going under contract.
- Sale-to-list price ratio. Whether homes are selling above, at, or below their asking price.
- Price per square foot. A rough way to compare homes of different sizes.
- New listings and pending sales. Whether supply is building or getting absorbed.
Each number tells you one thing. Read together, they show whether the market currently favors buyers or sellers, and how strongly.
Why can a single Sherman Oaks median price be misleading?
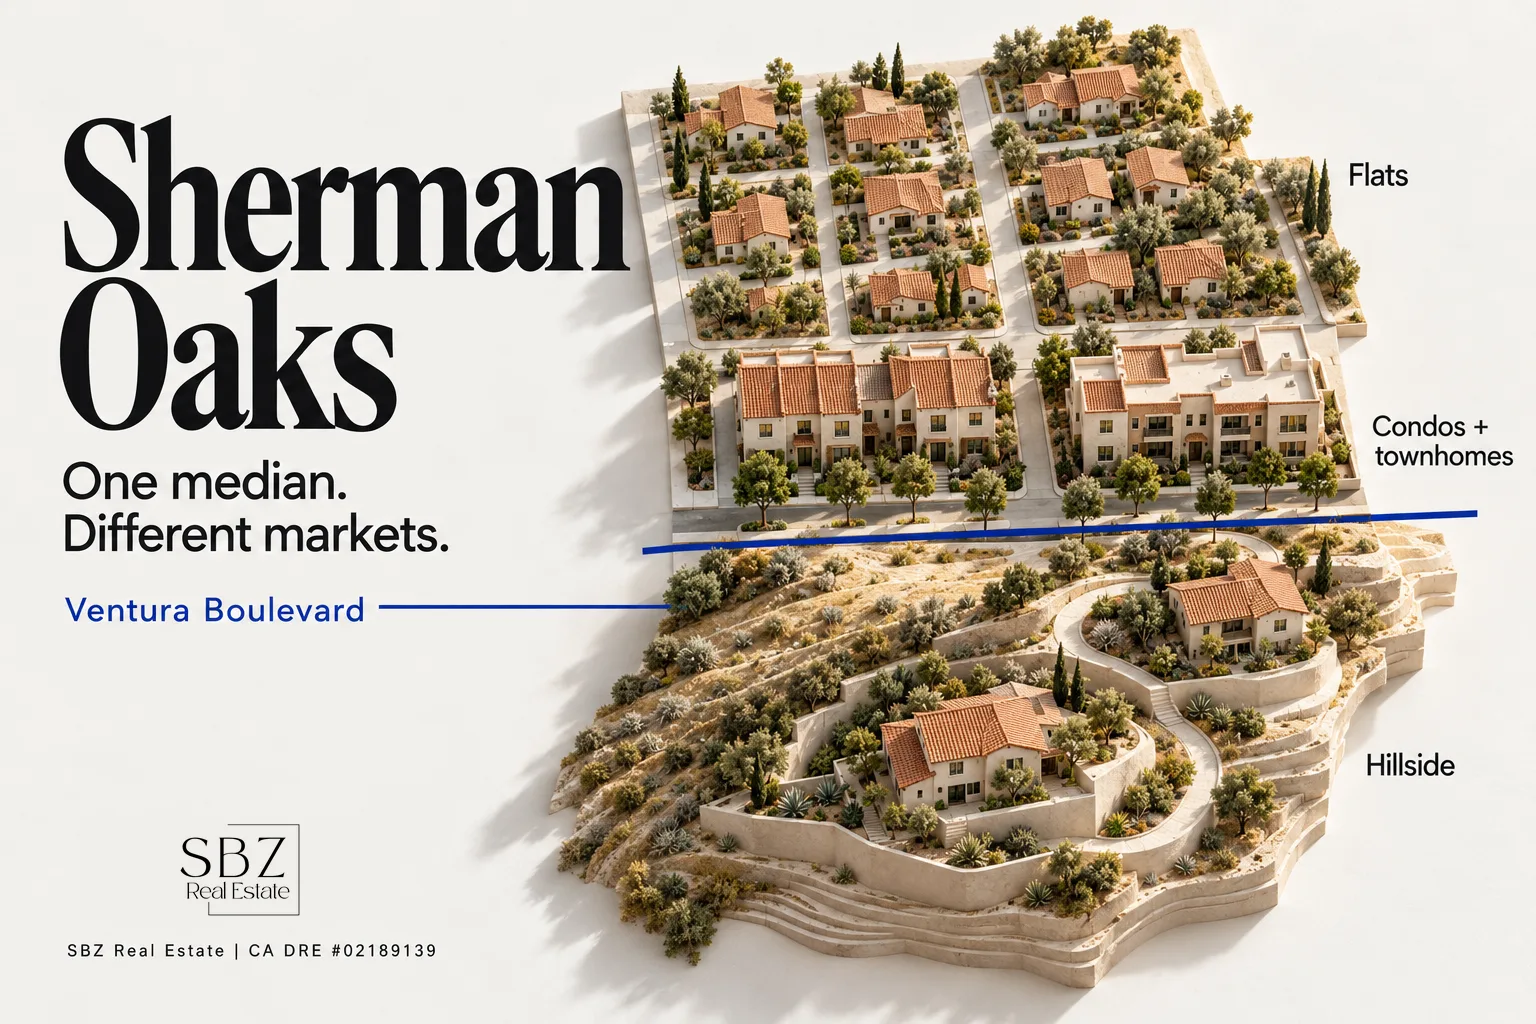
The thing most people miss is that "Sherman Oaks" isn't one market. Hillside homes south of Ventura Boulevard, with canyon views and winding streets up toward Mulholland, trade very differently from single-family homes on the flatter grid north of the boulevard. Condos and townhomes near the Ventura corridor and the 101 are a third market altogether.
A median price mixes all of them. If more hillside homes close in a given month, the median can jump even when nothing changed for a typical flats bungalow. If more condos close, it can dip. In real terms, the headline median tells you which homes happened to sell that month as much as it tells you about prices.
When you read a report, ask whether you can split the data by:
- Property type: single-family, condo, or townhome.
- Location: south of Ventura (hillside) or north of Ventura (flats).
- Size and lot: a view lot on a hillside and a level lot with a pool are not comparable.
Which metrics matter most if you're selling in Sherman Oaks?
For sellers, the most useful numbers are days on market and sale-to-list ratio for homes like yours. When comparable homes go under contract quickly and close at or above asking, pricing has more room. When days on market are climbing and price reductions are showing up, the market is telling you buyers have options.
Inventory trends matter too. A rising count of active listings in your segment means more competition for the same buyers, and that should shape your list price, how much preparation you do, and how you time the launch. For more on timing, our piece on the best time to sell a house in California covers what seasonal patterns can and can't tell you.
What a market report can't do is price your specific home. That takes a comparative market analysis built from closed sales that genuinely match your property. Our guide to what a CMA is in real estate explains the difference, and how to price your home to sell in Los Angeles walks through how that analysis turns into a list price.
Which metrics matter most if you're buying in Sherman Oaks?
Buyers should watch inventory, price reductions, and sale-to-list ratio. Low inventory with homes regularly closing over asking means you need to be ready to move: financing lined up, a clear sense of your limits, and quick decisions. Rising inventory and more price cuts usually mean more room to negotiate on price, credits, or terms.
Price per square foot is useful for spotting outliers, but use it carefully here. Hillside homes can carry a premium for views and privacy, along with costs the number doesn't show, like grading, retaining walls, or higher insurance in fire-prone canyon areas. Flats homes may come with a larger usable lot. Neither side of the boulevard is simply "better." They're different trade-offs, and the data only makes sense once you know which one you're shopping.
Not every home shows up in public data, either. Some Sherman Oaks sellers choose quiet or private sales, which you can read about in our guide to off-market homes for sale. If you're house-hunting, our home buying page explains how we approach the search.
How often should you check Sherman Oaks market data?
For most people, once a month is enough. Real estate data lags, because a closed sale reflects a deal negotiated four to six weeks earlier. Week-to-week swings in a small area like Sherman Oaks are often just noise from a handful of transactions.
What deserves attention is a pattern that holds across two or three months, such as days on market rising steadily, or the sale-to-list ratio moving from above asking to below it. Those shifts tend to show up in pending sales and new listings before they reach the median price.
How does Sherman Oaks data compare with nearby communities?
Comparing nearby areas helps you see whether a change is local or regional. Sherman Oaks is often weighed against Studio City to the east, with its similar mix of hillside and flats housing south and north of Ventura, and against Encino and the communities further west. Our Studio City homes and market info page and the full list of communities we serve make side-by-side comparisons easier.
If prices are softening across the whole Valley at once, that's usually rates and broader conditions at work. If Sherman Oaks moves differently from its neighbors, something local is going on, and that's worth a closer look.
What should you do with the data once you've read it?
Use the report to frame your questions, not to answer them. A seller might ask what the current pace means for preparation and pricing, and what they'd actually walk away with. A seller net sheet turns that last question into line items. A buyer might ask how hard to push on an offer, or whether waiting makes sense.
We've been in business for 10+ years, and the most useful conversations we have with clients start with the data and then quickly get personal: their timing, their family's next chapter, what the move needs to accomplish. If you're thinking about a Sherman Oaks move, a quick conversation costs nothing. Reach us through our contact page, call 818-696-0888, or email hello@sbzre.com.
Frequently asked questions
Where does Sherman Oaks real estate data come from?
Most consumer-facing reports draw on public listing and sales data from portals like Redfin and Zillow, along with county recording data. The community guides we publish are built from Redfin and Zillow data and updated monthly.
Is the median home price in Sherman Oaks a reliable number?
It's a useful starting point, but it blends hillside homes, flats homes, and condos into one figure. Split the data by property type and by location relative to Ventura Boulevard before drawing conclusions.
Can a market data report tell me what my Sherman Oaks home is worth?
No. A report shows broad trends. Your home's value depends on closed sales that genuinely match its size, condition, lot, and location, which is what a comparative market analysis is for.
How often is Sherman Oaks market data updated?
Portal data refreshes frequently, but monthly is the most useful rhythm for reading it. Closed sales lag the market by several weeks, so short-term swings often aren't meaningful.
Does market data include off-market sales?
Often it doesn't. Private or quiet sales may never appear on public portals, so the published data can understate activity in some segments of Sherman Oaks.